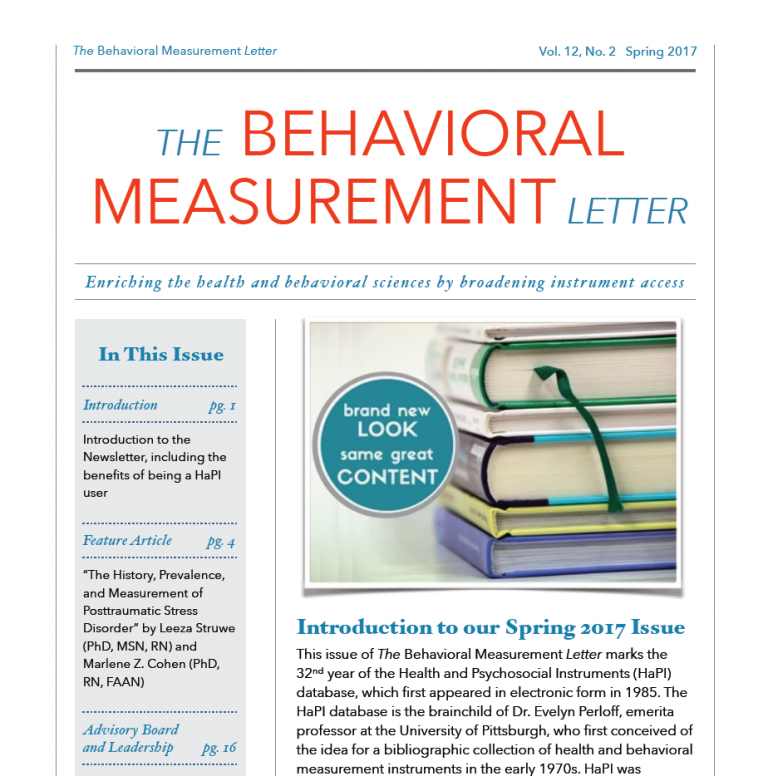
Continued article from the The Behavioral Measurement Letter, Vol. 4, No.2 Spring 1997
Fred B. Bryant
An exciting, new approach to construct validation is being pioneered quietly in the professional journals these days. Far away from the limelight, quantitative specialists labor silently in relative obscurity, systematically comparing alternative measures of the same construct to determine conceptual overlap and uniqueness, using state- of-the-art multivariate statistical tools. In this column, I briefly consider the wide-ranging benefits of this basic measurement thrust, and then spotlight illustratively a recent empirical example involving the construct of optimism as an illustration. In future issues of The Behavioral Measurement Database Letter, I will highlight this important measurement initiative from other research areas.
Although largely ignored in favor of more glamorous substantive research, this ground-breaking measurement contribution strengthens the foundation of empirical inquiry in several vital ways. First, comparative studies of related instruments fine-tune our understanding of exactly what our research instruments are measuring. Although multiple measures share the same conceptual “label” on the surface, they may well tap different aspects of the same construct or even different constructs altogether. Despite our tendency to judge books by their covers, the only definitive way to determine the degree of functional and conceptual equivalence across instruments is this emerging type of psychometric comparison. Such basic quantitative work better enables us to choose the most appropriate instruments for our research purposes. Next, another vital contribution of this basic ac measurement work is the improvement of conceptual clarity by identifying constructs that are truly unitary and by decomposing er multidimensional constructs into their constituent parts. This conceptual dissection explicates the meaning of research constructs empirically, documenting how respondents react explicitly to the instrument instead of relying implicitly on the instrument’s theoretical or intended structure. Multiple facets of conceptual variables can thus be identified and better understood, and gaps in measurement coverage can be highlighted for future research. Finally, this type of measurement foray often leads to refinements in existing instruments, creating psychometrically-purified forms of the original measures for future use. These modified measures offer greater conceptual precision and better reliability.
A 1994 article by Edward Chang, Thomas D’Zurilla, and Albert Maydeu-Olivares, (Cognitive Therapy and Research, 18, 143-160) illustrates the benefits of a comparative anatomy of measurement instruments. Chang et al. (1994) sought to improve understanding of the construct of optimism by comparing responses systematically to three measures designed to tap this construct: (a) the Life Orientation Test (LOT; Scheier & Carver, 1985, Health Psychology, 5. 219-247); (b) the Hopelessness Scale (HS; Beck, Weissman, Lester, & Trexler, 1974, Journal of Consulting and Clinical Psychology, 42, 861-865); and (c) the Optimism and Pessimism Scale (OPS; Dember, Martin, Hummer, Howe, & Melton, 1989, Current Psychology: Research and Reviews, 8, 102-119). That is, it was hypothesized that optimism consists of life orientation, hopelessness, and optimism itself and pessimism.
These instruments differ in at least four ways. First, they each reflect different conceptual definitions of optimism. Specifically, life orientation (LOT) defines optimism as both positive and negative expectancies about future outcomes. Hopelessness (HS) in contrast, considers only negative expectancies about self and future, while optimism and pessimism (OPS) define optimism as both positive and negative views of life in general. Second, the three instruments are usually scored differently. Specifically, the LOT and HS are typically summarized in terms of a total score; whereas the OPS is typically summarized in terms of scores on separate optimism and pessimism subscales. Third, the instruments differ in their length. Specifically, the LOT consists of 12 items, the HS of 20 items, and the OPS of 56 items. Fourth, the instruments have different response-formats. Specifically, the LOT and the OPS use a Likert response-format, whereas the HS uses a true-false format. Thus, although the instruments have similar titles, they take very different forms.
Administering the three instruments to a sample of 389 college students, Chang et al. (1994) used confirmatory factor analysis to test whether responses to each instrument were more accurately represented by a single, total score or by separate subscale scores. Analyses indicated that: (a) the LOT had separate optimism and pessimism subscales that correlated -.52; (b) the HS was most accurately represented by a single, total score that assesses pessimism; and (c) the OPS had multiple subscales that confound optimism and pessimism with several other overlapping constructs. To improve measurement precision for the OPS, Chang et al. omitted all OPS questions that did not clearly reflect either positive or negative expectancies (leaving only 14 items), and found that responses to the remaining items could be accurately represented by separate optimism and pessimism subscales that correlated -.45.
Chang et al. found additional differences when they compared the psychometric properties of the three instruments. The distributions of scores obtained from the different measures were not equivalent. Nor did the instruments show equivalent levels of reliability-specifically, the OPS optimism subscale was less reliable than any of the other subscales and than the HS total score. Intercorrelating the various scale scores from these three instruments, Chang et al. found that the subscales of optimism and pessimism showed good convergent validity and modest discriminant validity across the instruments. These results clearly indicate that the three instruments do not yield equivalent information.
As another means of assessing the validity of the distinction between optimism and pessimism, Chang et al. examined the relations between (a) the various scale scores from the three measures, and (b) external criteria of grade-point average (GPA) taken from college records and self-reported level of psychological stress as measured by the Derogatis Stress Profile (DSP; Derogatis, 1980, The DSP: A summary report, Towson, MD: Clinical Psychometric Research). Whereas none of the optimism or pessimism subscales were significantly correlated with GPA, all correlations with DSP total score were statistically significant (i.e., higher optimism related to lower stress, higher pessimism, to higher stress). Subsequent analyses revealed that scores on the LOT optimism subscale had more to do with self-reported stress than did scores on the OPS optimism subscale-a finding that seems to reflect the lower reliability of the latter measure.
Chang et al.’s findings challenge the traditional theoretical view of optimism and pessimism as polar opposites of a single continuum; and they demonstrate that the data from any one particular instrument should not simply be integrated with the data from a seemingly related instrument, unless there is evidence that the two measures are factorially congruent, that is, that they assess the same concept. Although all three instruments might appear at first glance to be equivalent, Chang et al.’s data indicate otherwise, and their results better enable researchers to make informed choices about instrumentation. Clearly, this type of “behind the scenes” measurement work shows great promise for enhancing conceptual and psychometric precision in the social and health sciences.
HaPI Thoughts
Is the glass half empty or half full or could it be both?
Folk wisdom suggests that how you see the glass reflects your level of dispositional optimism. Such face validity is often accepted. Without empirical evidence, belief in the accuracy of the contents in the glass remains a matter of “faith validity.”
Give us your opinion!
Read additional articles from this newsletter:
The Multitrait Multimethod (MT-MM)
Measuring Perceptions of Relational Communication
4-2-spring-1997
