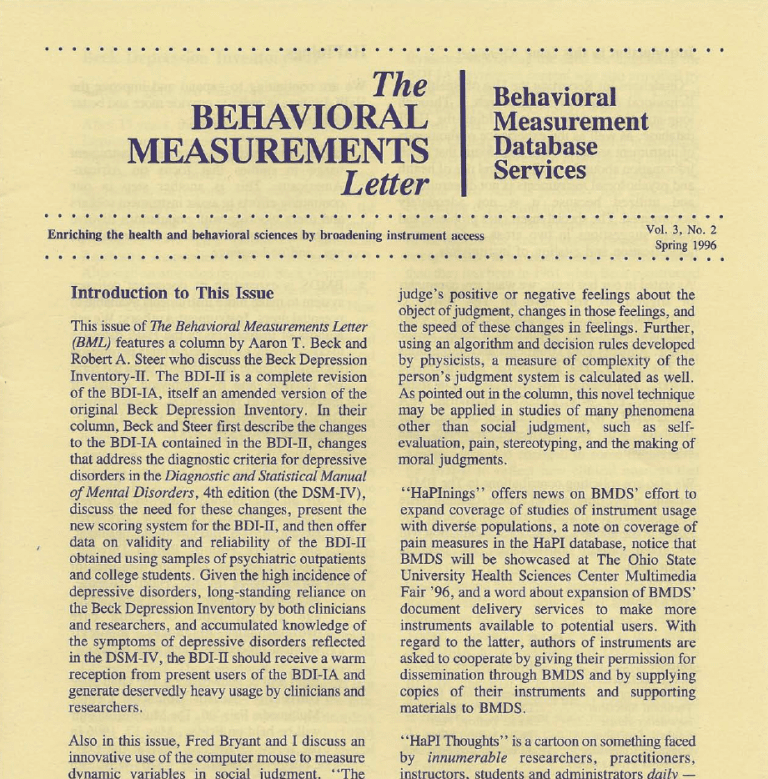
Continued article from the The Behavioral Measurement Letter, Vol. 5, No.2 Spring 1998
Fred B. Bryant
In a previous column (The Behavioral Measurement Letter 4(2), 7-9), I described a powerful new approach to construct validation. This approach, comparative studies of measurement instruments, is being pioneered by quantitative specialists who systematically compare alternative measures of the same or related constructs using state-of-the-art, multivariate statistical tools to determine conceptual overlap and uniqueness of the instruments examined. As I wrote in the earlier column, by fine-tuning our understanding of what measurement instruments actually measure, comparative studies of related instruments: (a) better enable one to choose the most appropriate instruments for the intended purpose; (b) improve conceptual clarity by identifying constructs that are truly unitary and by decomposing multidimensional constructs into their constituent parts; (c) highlight gaps in measurement coverage for instrument development; and (d) often lead to refinements in existing instruments, creating modified measures with improved conceptual and statistical precision. In the present column, I discuss “measurement modeling,” the state-of-the-art, multivariate statistical technique that underlies much of current comparative work on instrumentation. Here I describe what this technique is and how researchers use it to improve our understanding and use of measurement instruments. The substance of this column will serve as the foundation for columns on comparative studies of instruments and construct validation to appear in upcoming issues of The Behavioral Measurement Letter.
Measurement modeling is the most powerful and versatile tool available for studying how measurement instruments work. With measurement modeling, an investigator can construct and systematically compare a variety of alternative hypothetical frameworks for describing how people respond to a set of measures that constitute an instrument. These explanatory frameworks, or “measurement models,” represent competing theoretical perspectives on the specific construct or constructs that a particular instrument taps. Each measurement model can be evaluated in terms of how well it explains how people respond to the particular instruments, and alternative, competing models can be compared to see which, if any, best explains the actual data.
Measurement modeling, also known as confirmatory factor analysis, is a special form of structural equation modeling that investigates the “structure” underlying a set of measures collected from a group of people. “Structure” refers to the ways in which responses to the individual measures interrelate (if they do) to define one or more underlying constructs, or factors. Through measurement modeling, researchers can: (a) determine the appropriate number of constructs or factors underlying responses to a set of measures; (b) interpret the meaning of each factor in order to label each construct in theory-relevant terms; and (c) quantify how strongly each measure characterizes each underlying factor, thereby pinpointing the specific subsets of questions that define the constructs. Questions that strongly reflect a particular factor are said to have strong “loadings” on the factor or to “load” highly on that factor (i.e., each question’s factor loadings reflect how strongly each underlying construct influences responses to that question).
Measurement modeling may be likened to imaging objects in space using a bank of telescopes, each providing a separate field of vision with more or less clarity of focus, similar to a survey instrument comprised of questions that measure a construct with greater or lesser precision. In telescopic imaging, the separate images from the telescopes are integrated and analyzed to determine: (a) the number of objects being viewed, (b) the clarity with which each telescope focuses on its target object, and (c) the identity of the objects. Similarly, in measurement modeling responses to the questions comprising the measurement instruments are integrated and their interrelationships analyzed to determine: (a) the number of underlying constructs, (b) the questions that load on each factor, and (c) the identity of the underlying constructs being measured.
When the set of questions taps more than one underlying construct, then the measurement model is said to be “multidimensional.” For a multidimensional model, one can determine how strongly the multiple constructs relate to one another. For example, the researcher can test the hypothesis that the underlying constructs are unrelated to one another (i.e., an orthogonal model), or that the underlying constructs are correlated with one another (i.e., an oblique model). In the latter case, measurement modeling enables the researcher to compute the correlations among the factors. Say, for example, that measurement modeling of a patient satisfaction questionnaire revealed that the set of measures primarily assessed two underlying constructs, ratings of satisfaction with care received from physicians and ratings of satisfaction with care received from nurses. If these two factors correlated at r = 0.5, then the factors would share 0.52 x 100%, or 25%, of their variance in common. Thus, although the two constructs (i.e, satisfaction with physicians’ care and satisfaction with nurses’ care) are correlated, they nevertheless each measure primarily unique aspects of care (i.e., the remaining 75% of their variance is unique).
For each measurement model evaluated, the researcher must formulate hypotheses and specify information about four aspects of the model: (a) the number of underlying factors (i.e., how many different constructs the instrument taps); (b) the specific measures that serve as observed indicators for each of these constructs (i.e., which measures reflect which constructs); (c) if the model is multidimensional, the nature of the relationships among the factors (i.e., if and how the multiple constructs relate to one another); and (d) whether the variance in each measure that is unrelated to the underlying constructs is correlated or uncorrelated across the multiple measures (i.e., whether the unique errors in the measures covary or are independent).
The investigation often begins by testing a “null” model that assumes that there are no underlying factors (i.e., that the multiple measures share nothing in common). Researchers usually wish to reject this null model in favor of a more conceptually meaningful structure. Thus, the null model serves as a baseline against which to contrast the “goodness-of-fit” of more complex measurement models. After testing the null model, one then evaluates increasingly complex models, starting with a one-factor (unidimensional) model that assumes that the set of questions reflects a single underlying factor. Next, one tests multifactor (multidimensional) models, the simplest of which, the two-factor model, postulates two underlying constructs that could be either uncorrelated (orthogonal model) or correlated (oblique model).
Unlike most inferential statistical testing where mean scores (i.e., average levels of responses) are analyzed, measurement modeling analyzes relationships among a set of multiple measures to investigate the structure of measurement instruments. Although these interrelationships can be expressed in terms of correlations between measures, in measurement modeling one typically analyzes covariances between measures. A covariance between two measures is the correlation between the measures multiplied by both of their standard deviations. Covariances thus incorporate information not only about the degree of association between measures, but also about the amount of variability in these measures.
It should be noted that the procedure described above is analysis of covariance structures as done in measurement modeling, and should not be confused with analysis of covariance, or ANCOVA, an inferential statistical tool. The former, analysis of covariance structures, analyzes the structure of relationships among multiple measures – how measures covary with one another, whereas the latter examines mean differences between groups after adjusting for individual differences on covariates that have been measured in a pretest.
There are three computer programs that are most commonly used in measurement modeling: LISREL, which stands for LInear Structural RELationships; EQS, pronounced “X”; and AMOS, which stands for Analysis of MOment Structures. Each of these programs is available for Microsoft Windows” and provides publication-quality diagrams of the models being evaluated. LISREL is currently the most popular. Moreover, it has been available the longest and, therefore, a larger body of literature has accumulated concerning its use and its accuracy under conditions violating its statistical assumptions.
In measurement modeling studies, the computer program: (a) uses the raw scores to compute the actual, observed covariances among the multiple measures; (b) employs the measurement model hypothesized by the user to predict what the observed covariances among the measures should have been, assuming that the hypothesized model is accurate; (c) determines the differences between the covariances predicted by the user’s model and the covariances that were actually observed, and (d) computes a maximum-likelihood chi-square value estimating the probability that the predicted covariances differ from the actual, observed covariances by chance alone.
Unlike other inferential statistical tests for which significant p-values represent a positive result, in measurement modeling a statistically significant chi-square indicates that the model failed to predict the observed data accurately (i.e., the covariances predicted by the measurement model differ significantly from the actual, observed covariances). On the other hand, if a measurement model fits the data well, then the covariances that it predicts are not statistically different from the actual, observed covariances (i.e., the chi-square test results in a nonsignificant p-value).
It is important to note that measurement modeling not only enables one to determine the number of constructs that a particular instrument measures, but also allows for comparison of different instruments to determine the degree to which they measure the same construct(s). Thus, having determined the most appropriate measurement model for each of two instruments administered separately to the same sample, the researcher can then analyze the combined data from the two instruments to determine whether the same construct or constructs influence responses to both instruments. This type of “comparative anatomy” refines our understanding of the match between different conceptual and operational definitions (i.e., enhances construct validity) and improves users’ ability to select the most appropriate instruments for their purposes, thereby maximizing conceptual precision.
This column has discussed the conceptual and methodological bases of measurement modeling, and its use in clarifying the constructs that instruments actually measure and in comparing instruments that supposedly measure the same or different constructs. Columns on the use of measurement modeling in comparative studies of instruments and in determinations of construct validity will appear in future issues of The Behavioral Measurement Letter. Because it provides the conceptual framework for understanding these future columns, readers may wish to keep this column for later reference.
Fred Bryant is Professor of Psychology at Loyola University, Chicago. He has roughly 80 professional publications in the areas of social psychology, personality psychology, measurement, and behavioral medicine. In addition, he has coedited 5 books, including Methodological Issues in Applied Social Psychology (New York, Plenum Press, 1993). Dr. Bryant has extensive consulting experience in a wide variety of applied settings, including work as a research consultant for numerous marketing firms, medical schools, and public school systems; a methodological expert for the U.S. Government Accounting Office; and an expert witness in several federal court cases involving social science research evidence. He is currently on the Editorial Board of the journal Basic and Applied Social Psychology. His current research interests include happiness, psychological well-being, Type A behavior, the measurement of cognition and emotion, and structural equation modeling.
Read additional articles from this newsletter:
Spanking By Parents – Ideas on Measurement and Analysis
Bootstrapping the Way to Valid Diagnostic Interviews
5-2-spring-1998
